Charts & Mapping Resources
Explore our visual, interactive tools, giving insight into the complex supply-chain systems behind our everyday consumerables, as well as the dominant players in various sectors.
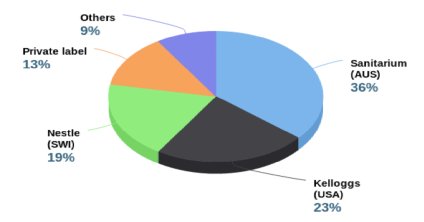
Market Share
Interactive chart looking at the concentration of brand ownership by multinationals; identifying the top 2 players in key grocery sectors and their market share. (2017)
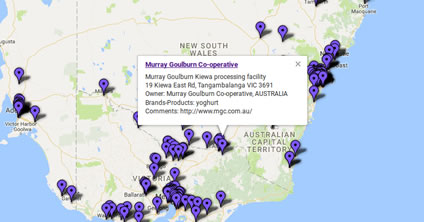
Manufacturing Map
A mapping resource showing production facilities of major food brands in Australia. Initial test version created to help users explore food miles and local employment. (2016).
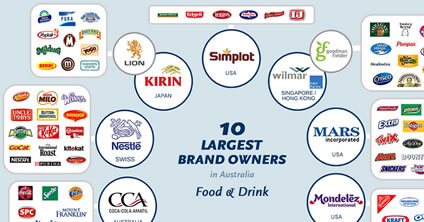
Brand Map
Who are the 10 largest brand owners for food and drink in Australia? The concentration of brand ownership by a small number of extremely large companies continues. (2016)
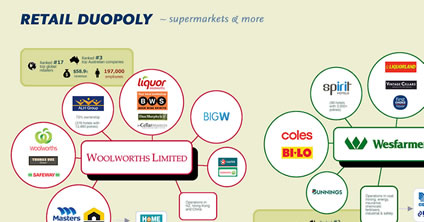
Retail Duopoly
40 cents in every dollar Australians spend goes to a Woolworths or Wesfarmers retail entity. See the reach of their interests, including liquor, hotels, fuel, hardware. (2014)
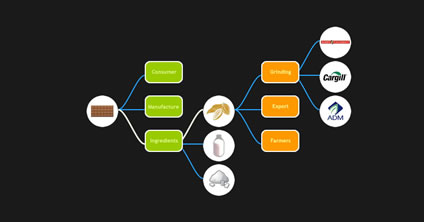
Chocolate supply chain
We often identify only major brand owners as the main players in particular supply chains. This map outlines key areas, issues, and players in the Chocolate supply chain. (2014)
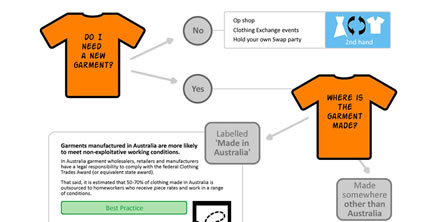
Clothing Choices - a quick guide
Modern-day slavery is used throughout the production of many clothing products. This chart shows some simple questions to ask to avoid labour exploitation. (2014)
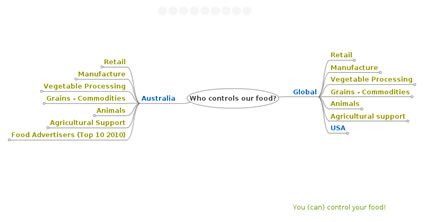
Who Controls our Food
Who controls our food and essentials? This interactive map shows the dominant players in areas of our Australian and global food production and retail. (Note: map from 2011).