Market Share
Here we take a look at the continuing concentration of brand ownership by large multinational corporations.
Support smaller Australian-owned companies where possible.
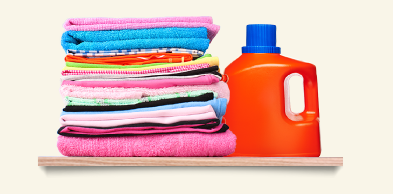
In the world of brands, all is not what it seems. Thousands of brands
jostle and compete with each other for our attention and money. Behind
the scenes we usually find that there is just a handful of corporations
behind this diversity. Our new interactive chart explores the dominant
players for common supermarket products.
The 2016 report by Choice "Market monopolies in Australia: squeezing out the
competition" suggests that "concentration
can be defined by the four largest firms controlling one-third or more
of the market". With this definition over half the industries in
the Australian marketplace are concentrated.
Mary Hendrickson and Bill Heffernan have explored concentration of
ownership in a global context. "A major concern about concentration in
the food system focuses on the control exercised by a handful of firms
over decision-making throughout the food system. The question is who is
able to make decisions about buying and selling products in a
marketplace." Their work use "CR4" showing the concentration ratio of
the top four firms in a specific food industry. Their most recent work, last updated in 2008, can be seen here
and here. Information on
specifics of market share is increasingly difficult to obtain, as Bill
highlighted back in 1999.
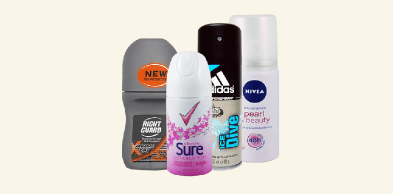
Here, in this interactive chart, we have looked at the top 2 players in
key grocery sectors in Australia. These sectors all have a high degree
of concentration with the top two having over 50% of the market share in most
cases.
What is not evident at first glance however is that in most areas
private label products (supermarket home brands) take up the third
position. Put together with the top two, these three largest players
make up between 70 -90%. In some areas it is over 95%. In bread for
example private label make up 31% and in-store bakey another 14%.
Supermarkets in all sector areas have a large market share.
"Private-label product ranges now account for around a quarter of all
supermarket sales" (2017 Retail World report).
The main players in supermarket retail are Woolworths
with 36%, Coles with 32% and Aldi with 12% . So realistically it is
these companies that dominate each sector too. See our Shop Ethical issues page for more on supermarket power and our Retail Duopoly chart for more on their reach
beyond grocery.
Make a difference and support smaller Australian-owned brands by
following the links from the tiles to our Shop Ethical comparision
pages, and shopping beyond the supermarket at food coops, farmers'
markets and local grocers and retailers.

BREAD
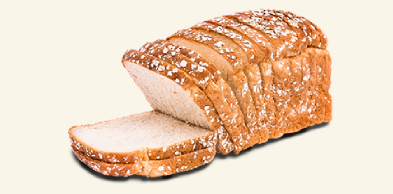
Dominant players BREAD - 51%


See the Shop Ethical 10 largest brand owners chart for brands with their owners.
This interactive chart uses the responsive template by Creative Tim. Data of 'market share according to volume sold' is gathered from Retail World Magazine, annual reports 2012-2015. It is intended to give a general trend of market share only. * Note: 'Goodman Fielder' in the bread tile is actually owned 50% by Wilmar, SGP and 50% by First Pacific, HKG; condensed due to space. [August 2017].